KPIs: secret sauce of S.M.A.R.T. goals in nonprofit program management

Which metrics, or program performance indicators are most crucial? What much you capture and what should you report? Cloud information systems enable us to capture vast amounts of information and help us organize and find meaning in the data; but which will be the telling factors when you look to evaluate nonprofit program performance and engagement? How many Key Performance Indicators (KPIs) should you use?
With current reporting and filtering tools, users group, summarize, and drill down to very specific levels based on filtering and relationships between the information. With the right metrics (and related goals), staff makes better decisions. With the wrong metrics, or even incorrectly reported metrics, you may inadvertently create a superficial or even dangerously false sense of meaning and validity. So, let’s think critically.
You might ask yourself:
- What are the non-profit program management key performance indicators (KPIs)?
- Are they directly measurable, or do we need to find a valid, related indicator?
- And is the company’s mission reflected in what is being measured?
Indicate, the very word itself, doesn’t even give us 100% assurance. Indicators “show” something else (Indicate definition at m-w.com), so we need to keep in mind that there’s a leap of logic between our data point indicators and the actual performance.
The bottom line bundle
Nonprofits have a tougher time than for-profit organizations, since for-profit groups, let’s be honest, can distill everything they do down to the finances. Not that nonprofits don’t need money to support their initiatives, but with the nonprofit’s 501(c)(3) status comes forbidden inurement, or the “benefit” to private individuals. The idea is, if we take away the ability to profit, then the people that make it go are freed to benefit others. Hence, the growing attention to the “Double Bottom Line,” or for those whose attention is on social impact, financial outcomes, AND environmental impact, the “Triple Bottom Line”.
Program management usually falls neatly under the social impact piece, unless the mission integrates sustainability (p.s., not a bad idea).
- The number of people entering training programs can indicate how a work reform organization is satisfying their mission goal.
- The number of students graduating, compared with the mean and median in the population can indicate whether the programs change their motivations, knowledge and abilities.
- The number of adoptions completed without surrenders in 2 months can indicate how well staff partner animals with appropriate adopters.
- The average length of time a museum visitor spends with each exhibit (yes, there are new ways to know this), can indicate whether exhibits sufficiently engage to increase learning.
If you’re thinking about change as a never-ending process, all of these are potentially important indicators, and they have merit for inquiry. As your organization matures, you may have more history with your metrics, and may be more confident in expressing confidence about relationships between indicators and outcomes. But, always maintain a healthy openness to the possibility that changes aren’t entirely within the realm of your control when you are expressing your social impact and ROI.
Getting the measures right, clear, …S.M.A.R.T.
If you notice, the KPIs are closely related with goals. In fact, goals don’t exist without performance indicators, so let’s explore what makes good ones.
Goals should be S.M.A.R.T: Specific, Measurable, Achievable, Relevant, and Time-bound. If a goal is all of these things, it is much more usable and useful.

Performance indicators mostly intersect with the S., the M. and the T.:
- Count of new client incidents/issues this month
- Dollars donated online this year
- Growth in social reach this week
- Average length of time students spent playing sports this month
- Total visitor hours spent in the gallery this week
- Average daily number of paper towels falling onto the floor in the bathroom
Anything that can be measured in a timeframe can be a performance indicator, but check it against your goal to find out if it is any good.
Consider the A., for instance: Attainable. If history shows you collected $21,000 last year in online donations, it might not be Attainable to set a goal at $122 thousand without a really strong argument.
How many days were sunny this year? How many gray hairs did you grow thinking about meeting your event attendance numbers?
- to the rescue! Not everything measurable is relevant. If you’re measuring things that nobody can take action on right now, that’s okay if you can afford collecting and storing data about it–to a degree (Herein face validity is helpful for deciding. Does measuring something without a known relationship to your goals take energy away from more obvious needs? Skip it). The growing interest in “Big Data” legitimizes the idea that there may be value in something yet undiscovered. Sidebar: this may be the only time you’ll catch us here at Buzzbold advocating for the “sniff test,” and you can learn more about how we help nonprofits with program performance and decision-making with a digital program management diagnostic.
On the other hand, if you’re reporting on a metric without Relevance to current goals and decision-making needs, now you have a problem. Record all you want, but staff attention spans and focus are much more expensive than gigabytes, so don’t be wasteful with reporting.
What can I control?
In the brief list of candidate performance indicators above, paper towels on the floor might be important if you’re a bathroom interior designer or you have janitorial duties, but probably are not Relevant if you’re the finance director. Relevance, then give us frame of reference, and what is S.M.A.R.T. has to be contextualized for each role.
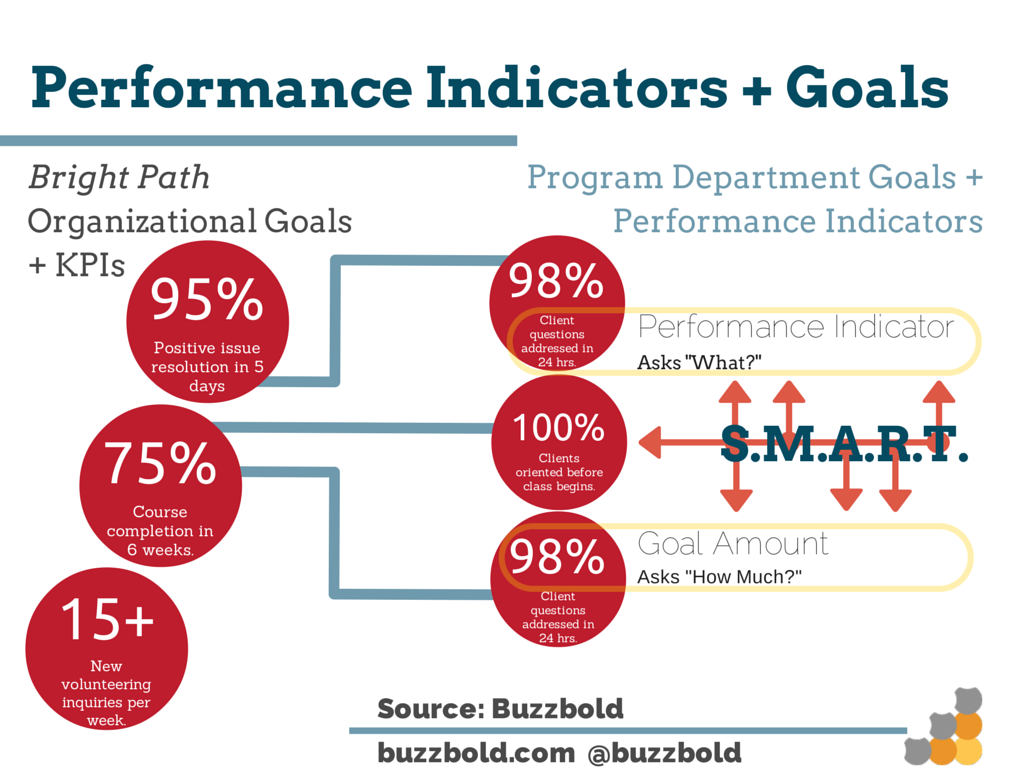
At the organizational level, only focus on the KPIs that the entire organization contributes to in one way or another. We do recommend keeping this list small. 3-4 is often referred to as a healthy count.
But of all of the indicators of performance throughout the organization, unless you’re the Executive Director, there are things that some staff have control over, and things they don’t. Let’s imagine we’re looking at a dashboard for all of Path Bright’s (a fictitious example organization) important measures. There are dozens. And, they’re all jammed into the same dashboard that shows up in staff mailboxes every day. We wouldn’t expect a high open rate, because many other emails having more clear relevance to today’s work also await.
Now imagine if the program department only had 3 organizational KPIs they saw each day, and then had their own metrics that ultimately rolled up to affect the organization’s total performance. Now we can expect program staff are more likely to be able to use this information, and more likely to review it. Efficacy, or one’s ability to actually create change in the scope of consideration, plays a big role in whether you should distract users with reported outcomes.
In other words, don’t push daily fundraising metrics to program staff about a specific campaign to renovate the main facility. Help them focus on metrics they need every morning to provide excellent service in the existing facility.
Get specific with the mission
Let’s look at our example again. Path Bright, whose mission is to “restore the emotional well-being to all that it touches,” might find such a condition hard to identify let alone measure. This example mission provides no guidance toward what key performance indicators might be important.
A clear purpose and mission statement will define which metrics are the frontrunners in determining successes and shortfalls.
If the answer to the question “how do we measure that?” is unclear internally, imagine how challenging it would be to understand the organization’s impact for a potential client, employee, or funder.
The qualitative conundrum
Let’s face it. Some of the most important ways to improve the world around us have to do with changing the hearts and minds of others, and sometimes the one thing we need to understand the most is opinion. Behavioral sciences have given us a HUGE toolset over the past 60 or so years as we have become more sophisticated and understanding the cognitive and social psyche.
The Likert scale alone. Wow, right? We can measure the mind based on relative scales. It is so easy to drop a question into SurveyMonkey and export a chart. Stop right there!
We have to be sure that we keep both the M. (Measurable) and the R. (Relevant) of S.M.A.R.T. in mind, especially if we haven’t tested our surveys, interview questions, and ratings for validity, because measuring what one says is not representative of what is real 100% of the time. In the grand scheme of your reporting, if too many KPIs are purely subjective, such as based on self-reported feedback, the organization risks the credibility and validity of its impact statements, because a prudent critic knows natural psychological biases (yes, we all have them), make it tempting to knowingly or unknowingly “encourage” positive ratings through subtle language bias and projection. Be critical of your own measurement tools and work to improve them (and ask a psychologist!).
If you’re facing challenges about understanding and correlating impact, consider complementing your qualitative feedback with correlated, hard facts. If you know that emotional well-being is correlated with reduced domestic violence (perhaps with good secondary research), or improved grades, or longer job retention, and have access to this data about your clients, consider capturing these supplemental statistics into your digital program management system where they fit in with your vision and values. Then report on changes you see, side-by-side. Just be totally clear when something should or shouldn’t be implying causation. In fact, if you’re clear enough about the need for more understanding about these relationships, you may find a funding partner interested in helping explore those relationships more closely.
Supporting nonprofit goals and metrics with digital program management systems
Thanks to analytics tool (desktop software such as Excel helps, but cloud technologies such as Salesforce and Google Apps far exceed for self-evaluation and collaboration with relational program information) the needs, characteristics, and program outcomes are queried and reported in the blink of an eye, and historical data is used for trend analysis.
Technical capabilities available to NPO’s, especially through the use of cloud information systems, provide vast amounts of data relationship and reporting options to users. Making it easy for staff to input and report on these indicators builds understanding of what is working, what should be given more attention or be reviewed, what should be overhauled for improvement, and what should be eliminated. Choosing the right mission-based metrics and promoting them internally makes for better nonprofit management.
Buzzold helps nonprofits align metrics with the mission
No matter where your organization is in its lifecycle stage, it can be helpful to step back regularly and ensure that what you are measuring is what you are impacting, and that your tools are supporting your decision-making, not just your status quo. We have developed powerful diagnostic tool, based on years of experience in serving a wide variety of nonprofit program management clients and needs, and are happy to offer a complimentary report to any nonprofit organization that is seeking to understand or plan for improved program performance.


